Is EUR/USD Setting Up to Hit 0.82?
The EUR/USD exchange rate could go well below the parity mark. It’s not just the fundamentals saying this; technical analysis also suggests that EUR/USD is headed much lower.
Before going into any details, I want to discuss a chart pattern called a descending triangle.
Advertisement

At its very core, this is a bearish chart pattern that is formed when there’s horizontal support and a downtrend in play; the price is forming lower highs, but not breaking below a certain level.
Once the support level is broken, the price tends to break lower.
How low could the price go? When it comes to technical analysis, there are almost always targets associated with chart patterns. With descending triangles, technical analysts look at the widest part of the triangle and subtract the length from the broken support level.
Note: This chart pattern fails if the price does not break below the support level and instead moves above the preceding downtrend.
With all this said, please look at the EUR/USD exchange rate chart below.
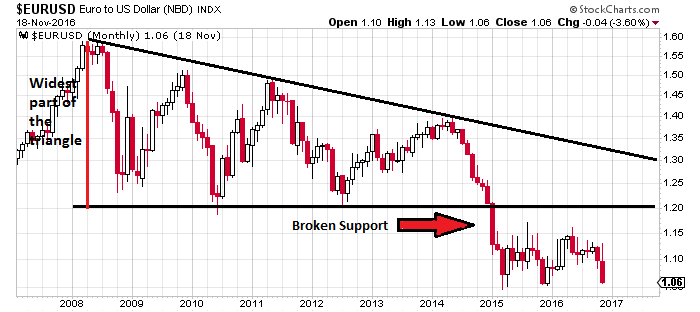
Chart courtesy of StockCharts.com
Since 2008, the EUR/USD currency pair was trading in a downtrend, with horizontal support at around 1.20. This level was broken in late 2014 and early 2015. The currency pair has been trading relatively sideways since then.
But don’t for a second think the decline in EUR/USD is over.
Pay attention to the widest part of the triangle labeled on the chart. Its roughly 0.38 in length. There’s still more downside ahead on EUR/USD for this pattern to completely finish.
Doing simple math here: if you subtract 0.38 from 1.20, you could be looking at a EUR/USD exchange rate well below the parity mark, at around 0.82 (or 22% lower than where it currently stands).
From a fundamental point of view, a move below parity on EUR/USD is very possible as well. There are two factors we are currently paying close attention to:
- The Federal Reserve is on track to raise its benchmark interest rates while the European Central Bank (ECB) is implementing negative interest rate policy (NIRP) and printing. This disparity in monetary policies could force investors to rush toward the U.S. dollar and ditch the euro.
- The eurozone’s economy remains fragile. The strongest countries in the common currency region are struggling to show growth. Forecasts for Germany’s economy until 2020 are dismal, to say the least. Other major economic countries, like France, Italy, Portugal, and Spain continue to show anemic growth. Understand that currencies move in line with economic conditions; with the U.S. economy performing relatively well compared to eurozone, it will put pressure on the EUR/USD exchange rate.
How to Make Money as the EUR/USD Moves Below Parity
As the EUR/USD heads lower, investors could take advantage with exchange-traded funds (ETFs) like the AdvisorShares Gartman Gold/Euro ETF (NYSEARCA:GEUR). This ETF holds gold in euro terms. As the EUR/USD rate declines in value, gold in relative euro terms goes higher, and this ETF could move higher.
Note: This is not a recommendation to buy, but just an idea of what kind of opportunities investors should be on the lookout for.